Home
Click to visit Japanese site


Spect-CAM-100vis
| □ | Hyper Spectral Imaging measurement of 380-780nm (Standard: 1280*2000pix*(No. of wavelength:960Ch)(Measureable 1280*3000pix Max.) |
|---|---|
| □ | Convert to imaging files per channel or wavelength 400-700nm(per 20nm), Others |
| □ | Convert to reflection ratio image with black/white standard plate |
| □ | Displayed in spectral specifying the point with ROI |
| □ | Calculate the color values after measuring 2-dimention (Standard light A, C, D65/Other arbitary light source) XYZ,CIELab、CIELuv etc |
| □ | Color composition by arbitary color-matching function |
| □ | Others/FIxed quantity calculation (option) |
Spectral Application Research Laboratory Inc.
In very near future the Spectroscopic analysis can be more visible and a user friendly. Currently the spectroscopic measurements are shown with the spectrum curve. The measurement will be seen by the commonly used devices like a digital camera. This is our expectation.
The techniques involved for those developments are called “Hyper Spectral Imaging”. The measurement device to press forward those development is “Hyper Spectral Imaging System or the Spectroscopic camera”. SARLI focuses on research and development of the measurement device and the application systems.
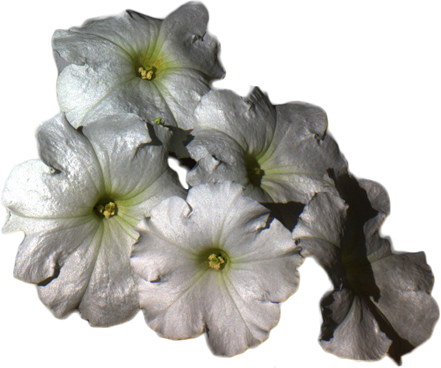
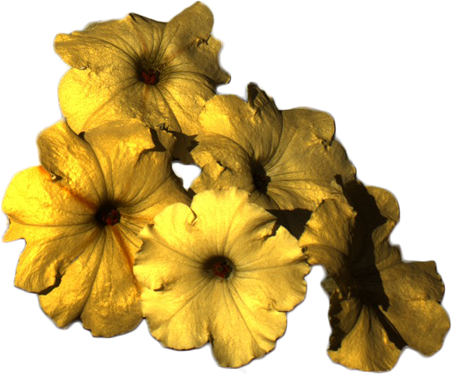
Example: R, G and B images are elaborated with the Sensitivity Function
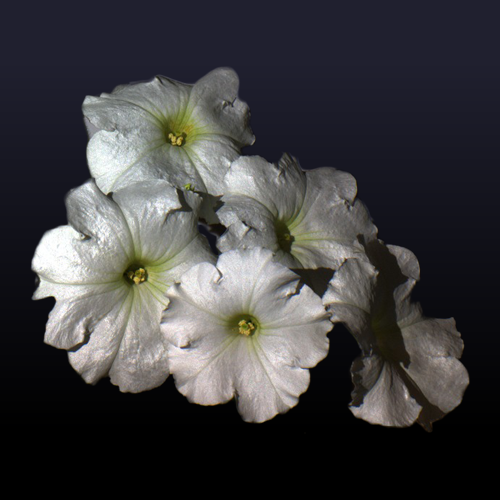
Visible range (white Petunia): white petals are shown with the visible range.

Range includes ultraviolet range (white Petunia): Red lines are shown, which were not visible in the visible range.

